

Mar 5, 2026, 4:04 AM CT
Share
Purpose: This Analysis Brief returns to a favorite BlackEconomics.org topic: The Power of the media and how it shapes our mind and behavior. Knowing that most media operations are held hostage to advertising revenue, it stands to reason that without advertising revenue certain media operations would cease to exist. Therefore, the symbiotic relationship between the media and advertising ensures that the two collaborate to enforce a vice grip on our lives. Media spares no expense to keep us engaged so that it can secure the advertising revenue that enables the media’s survival.
Introduction
Our lives were flooded with several important and powerful events last week: The State of the Union Address; a media awards programs with an unfavorable illness-driven outburst; news about economic growth, stock market hiccups, and inflation; and a long-awaited but certain attack on the Muslim World. This represents a considerable amount of information to digest, but we were well prepared to receive it. Really? Yes! It was “advertised” well in advance. Rest assured that the purpose of almost all, if not all, media content is to advertise: i.e., to entertain minds so that they are ready to receive advertisements, or provide informational content that, at its root, is some form of advertisement.
This Analysis Brief is a reminder that our lives are governed largely by the media, and the media helps direct our activity through advertising. Our consumption and our actions are motivated in significant ways by advertising. The business and economic literatures are transparent concerning these points, and important contributions to these literatures indicate that advertising was commonplace as early as the 17th century.i
How Important is Advertising?
We became fixated on advertising last week for no apparent reason. We remembered our long-held intent to prove the outcomes discussed in the previous paragraph statistically using readily available data. However, we had not set aside time to undertake the research. A time window opened last week, we collected the data, and we present the results of our straightforward Ordinary Least Squares (OLS) regression analyses that are not as bright and beautifully blue as the sky and ocean waters of Oahu appear, but they are sufficient to prove our hypotheses.
For those unfamiliar with such statistical analyses, please do not worry and do not feel excluded from the conversation. Bypass the technical symbolism and vernacular of econometrics. Focus on the analytical results, which are easily comprehended. “There is no rocket science but rocket science itself.” A little-known secret is that all economists are not equal. Economists are not licensed, so we are not held to the same qualifying standard. Each degree granting institution separately determines who is hooded. Therefore, certain economists have a constrained command of statistics, which may be greater, equal to, or less than your own.
Details (variable names, sources, characteristics, and expected arithmetic signs for the related regression model coefficients) concerning annual data that enter our regression analysis models are provided in Table 1 (page 3) . The variables of interest are: (1) Real business (not total) receipts (RBR) of US corporations; (2) the number of IRS 1120 tax returns (NOR) filed by corporate firms; (3) Real advertising expenditures (RAE) by corporate entities; and (4) the growth in real (chained dollars) gross domestic product (RGDP) during a year. Data for the models span 2001 – 2022 and all variables undergo natural logarithmic transformations for uniformity and statistical standards purposes.
As a preliminary test of a “Bayesian Prior” (i.e., that advertising reflects a time decay (distributed lag) process), we estimated the correlations between RBRt and RAEt and RBRt and RAEt-1 (see Table 2). The table reveals that the latter correlation reflects lower positivity than the former. Hence, our analytical models only concern simultaneous effects between RBRt and RAEt. In other words, we rejected our Bayesian Prior and concluded that, for this analysis, we would ignore the question of whether previous-period advertising impacts current-period receipts.
Equation (1) presents the core regression model that we estimate:
Equation 1:

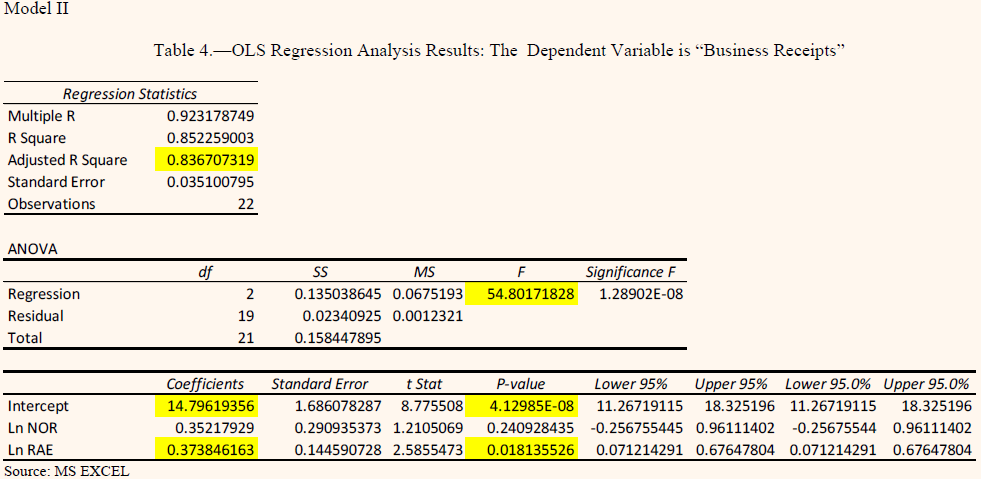
Where α represents the estimated model coefficients (with α1t serving as a “constant” term), t is the time indicator (t and t-1), ln indicates a logarithmic transformation of the variables that were already identified, and ε represents the error term that is assumed to be randomly and identically distributed. For Model I, all the variables are considered. For Model II, the RGDP variable is excluded from the model for reasons to be explained below.
Results for Models I and II are presented in Tables 3 and 4 (pages 5 and 6). They reveal that these straightforward OLS statistical regression models reflect a high level of explanatory power. Specifically, the Adjusted R-Squares indicate that at least 83 percent of the variation in the RBR variable is explained by both models.
Also, and unsurprisingly, Models I and II (Tables 3 and 4) indicate that the elasticity of the relationship between RAE and RBR ranges from 0.39 percent and 0.37 percent, respectively. That is, at the margin, a one (1.0) percent increase in RAE is expected to be associated with a nearly 0.40 percent increase in RBR.
Importantly, we exclude the RGDP variable from Model II (Table 4) because its coefficient in Model I (Table 3) reflects an unexpected, but theoretically logical negative relationship with RBR.ii On the other hand, this unexpected result could indicate distortions in regression models caused by “multicollinearity.”iii A test of the correlation between RAE and RGDP yielded a correlation coefficient of .971, which signals high collinearity between the two variables.
Conclusion
In accordance with the results of our statistical analysis, we conclude that firms’ spending on advertising is effective in helping generate sales and thereby increases business receipts. As Black Americans, however, we should certainly not permit the analysis to conclude with the latter statement. We should continue with the analysis and consider the following important questions about the media and advertising:
•How much media do we consume (adults and youth)?iv
•How much advertising do we encounter when we consume media?
•Do we purposely prevent advertising from reaching our subconscious minds, where it can drive our spending behavior at an unconscious level?
•Do Black American entrepreneurs expend sufficiently on advertising to achieve optimal results?v
•Has media and its advertising imprisoned us in a cycle of earning to spend, so that we are unable to pause, contemplate, and develop and execute a life plan that produces a much higher and more favorable level of overall wellbeing?
The foregoing series of questions may operate as an internal barometer for measuring our wellbeing. However, our lives are enmeshed in a broader and wide-ranging US socioeconomic system. Hence, it is appropriate for us to consider the extent to which the entire society is driven by advertising.
Consider that:
1.Income and wealth are at the top of our hierarchy of needs.
2.To secure income and wealth, we work.
3.We enjoy employment opportunities because our public or private sector employers incur advertising costs to sell their products.
4.To sustain the American dream and mystique, the nation’s governments rely heavily on their spending power, which serves as a form of advertisement.
5.Although certain adherents of monetary economic theory may disagree, few Americans reject the notion that government spending is linked to tax revenue, and that tax revenue rises when economic growth increases.
6.Economic growth accelerates or is sustained when firms advertise to increase sales.
Because the results of our statistical analyses support the conclusion that our world turns on advertising, we now comprehend how we arrived at all the favorable or unfavorable outcomes identified in the first paragraph of this Analytical Brief.


Endnotes
i Charles Allen (1942). “The Press and Advertising.” The Annals of the American Academy of Political Science. Vol. 219. The Press in the Contemporary Scene. (January), pp. 86-92. https://www.jstor.org/stable/1023897 (Ret. 030226).
ii In certain cases, it is reasonable to expect that when the economy is growing at an elevated rate (a high growth rate for real GDP), firms may be motivated to reduce their advertising expenses. On the other hand, and the basis of our “Bayesian Prior,” economists often adopt the mantra: “More is better.” That is, if spending on advertising engenders higher receipts, then why halt or reduce that spending—even if receipts and the economy broadly are experiencing growth at an elevated rate?
iii Econometricians recognize the distorting effects of high multicollinearity on statistical results and act to eliminate it. The often-used remedy is to remove one of two highly correlated variables from the right-hand side of the regression equation.
iv The Bureau of Labor Statistics produces the American Time Use Survey (ATUS). It is common knowledge that the ATUS has a persistent record of reporting that Black Americans spend more time in an entertainment mode (Leisure and Sports) than any other racial/ethnic group in the US. (Ret. 030226)
v According to the Census Bureau’s Annual Business Survey for 2023, there were about 4.6 million Black American owned enterprise, but only about 200K were employer firms; the remainder were nonemployer firms. It could be that Black enterprises form in industries that are too competitive and do not offer opportunities to grow sufficiently to take on employees. It may also be the case that many of the nearly 4.0 million Black American owned nonemployer firms are operating as hobbies/side hustles; not as going concerns determined to optimize production, earnings, and profits/net income. However, it is also true that too many Black enterprises’ financial capital structure is inadequate to permit adequate advertising expenditures, which can help produce greater profitability and growth, and an opportunity to become employing firms. (Ret. 030226)
vi The following are few data points that may be of interest concerning spending on Advertising: (1) For the period 2001-2022, the average annual ratio of Advertising expense-to-Business Receipts and of Advertising expense-to-Total Deductions (expenses) reported on Form 1120 to the IRS was 1.15 percent and 1.07 percent, respectively; and (2) The total values for Business Receipts, Total Deductions, and Advertising expenses from Form 1120 filed with the IRS for tax year 2022 were $39.9 trillion, $41.3 trillion, and $473.2 billion, respectively.
vii The following are URLs where the statistics used in this analysis can be identified (Ret. 022726):
BEA: https://apps.bea.gov/iTable/?reqid=19&step=2&isuri=1&categories=survey (NIPA Table 1..6.—Real Gross Domestic Product, Chained Dollars)
BLS: https://www.bls.gov/cpi/
FRED: https://fred.stlouisfed.org/
SOI: https://www.irs.gov/statistics/soi-tax-stats-corporation-tax-statistics (Table 2.1. Balance Sheet, Income Statement, and Selected Items, by Size of Total Assets; and Table 27. Balance Sheet, Income Statement, including Investment Data, by Selected Sectors).

Want More Local News?
Civic Media
Civic Media Inc.
The Civic Media App
Put us in your pocket.